LAC LA Clippers
2026-27 regular season
431/939 FG · 45.9% FG% · 54.3% eFG% · 38.2% 3P%
Shot chart
Export
Shooting signature
Shot proportion by distance
Field goal percentage by distance
Shooting frequency by side
Field goal percentage by side
Roster by attempts
Keys: j/k rows, Enter opens, h/l columns, s sort, / search
| Volume | Shooting | Usage | |||||||||||
|---|---|---|---|---|---|---|---|---|---|---|---|---|---|
| Player | |||||||||||||
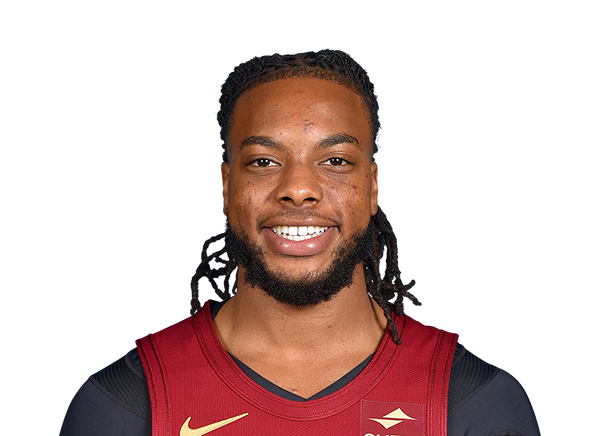 | Darius Garland | 11 | 363 | 169 | 46.7% | 54.7% | 36.0% | 59.5% | 75.0% | 40.0% | 44.4% | 28.1% | 10.1% |
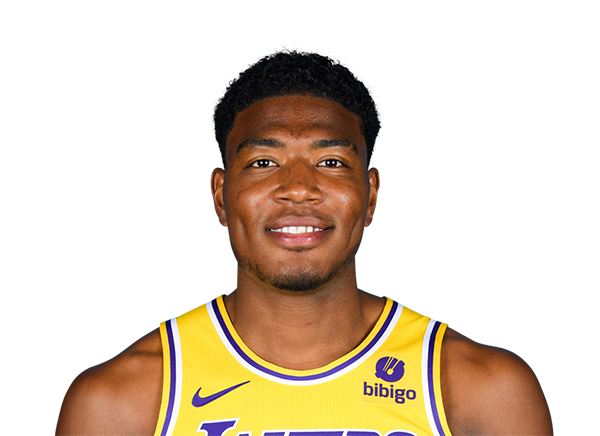 | Rui Hachimura | 9 | 268 | 115 | 37.4% | 45.7% | 34.5% | 48.6% | 50.0% | 18.2% | 47.8% | 22.3% | 7.8% |
 | Brook Lopez | 11 | 265 | 114 | 56.1% | 63.2% | 42.1% | 64.1% | 83.3% | 35.7% | 33.3% | 21.7% | 12.6% |
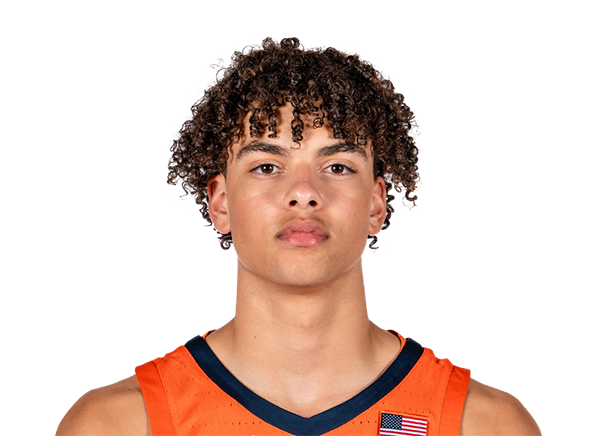 | Keaton Wagler | 11 | 250 | 92 | 34.8% | 45.1% | 35.8% | 57.2% | 53.8% | 10.0% | 57.6% | 23.2% | 10.4% |
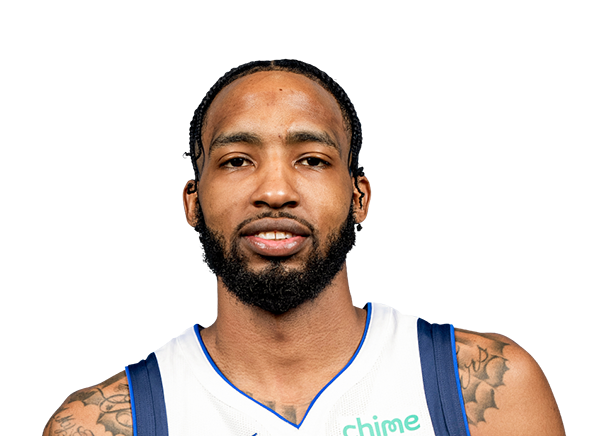 | Derrick Jones Jr. | 10 | 291 | 83 | 50.6% | 63.3% | 48.8% | 63.9% | 66.7% | 0.0% | 51.8% | 14.7% | 8.9% |
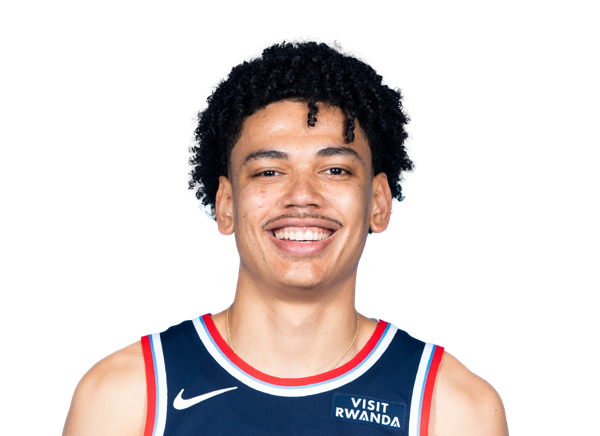 | Kobe Sanders | 11 | 257 | 81 | 42.0% | 53.1% | 36.7% | 58.2% | 68.8% | 50.0% | 60.5% | 17.0% | 7.7% |
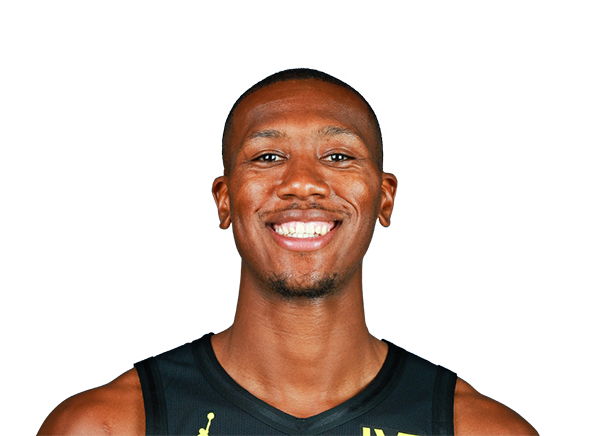 | Kris Dunn | 11 | 305 | 65 | 47.7% | 55.4% | 40.0% | 60.0% | 59.3% | 0.0% | 38.5% | 12.3% | 9.7% |
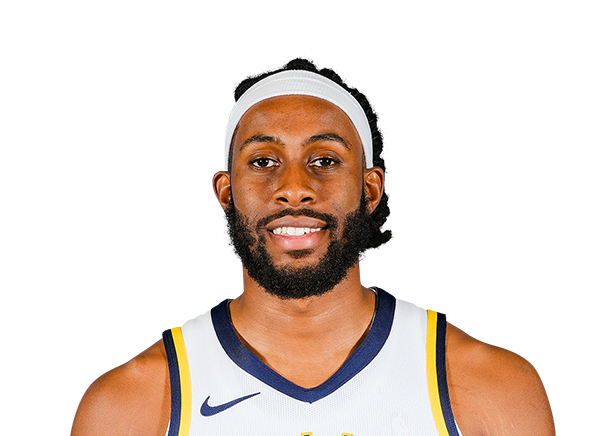 | Isaiah Jackson | 10 | 201 | 61 | 55.7% | 56.6% | 33.3% | 57.3% | 71.1% | 40.0% | 4.9% | 17.1% | 8.7% |
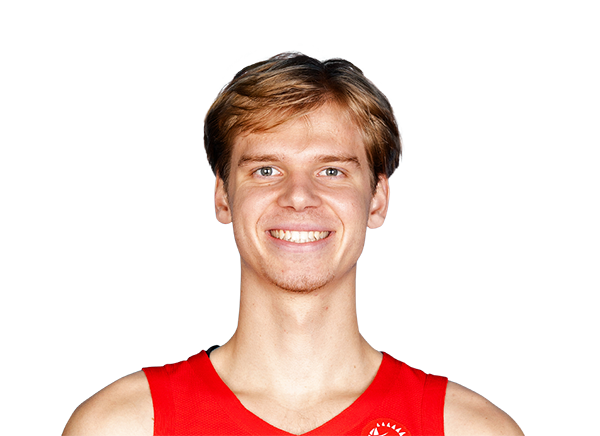 | Gradey Dick | 11 | 172 | 60 | 53.3% | 61.7% | 47.6% | 64.1% | 69.2% | 20.0% | 35.0% | 18.0% | 10.0% |
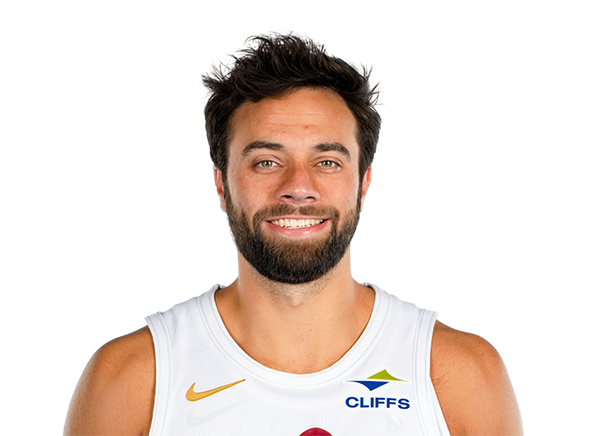 | Max Strus | 5 | 111 | 43 | 32.6% | 43.0% | 28.1% | 46.0% | 55.6% | n/a | 74.4% | 17.1% | 8.0% |
 | Baba Miller | 9 | 94.3 | 22 | 59.1% | 63.6% | 40.0% | 70.6% | 77.8% | n/a | 22.7% | 16.2% | 11.9% |
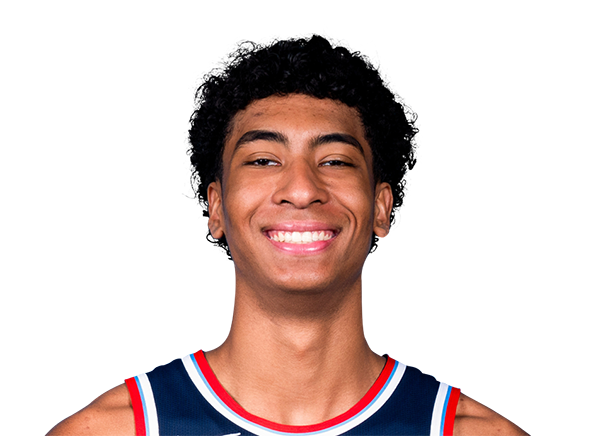 | Cam Christie | 5 | 29.6 | 11 | 18.2% | 22.7% | 25.0% | 29.5% | 25.0% | n/a | 36.4% | 19.7% | -1.5% |
 | Nick Martinelli | 5 | 22.0 | 11 | 63.6% | 72.7% | 66.7% | 74.3% | 100.0% | 50.0% | 27.3% | 24.1% | 20.5% |
 | Jalen Pickett | 5 | 26.0 | 8 | 50.0% | 62.5% | 66.7% | 62.5% | 100.0% | 50.0% | 37.5% | 15.0% | 12.4% |
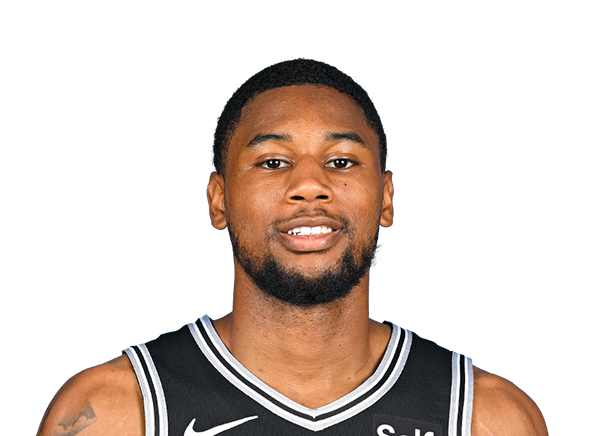 | Blake Wesley | 2 | 9.4 | 4 | 0.0% | 0.0% | 0.0% | 20.5% | 0.0% | n/a | 50.0% | 20.8% | 0.0% |
FGA and shooting splits count this team's shots; rim = restricted area, mid = mid-range, 3P rate = threes / FGA. * GP, MIN, FGA/g, TS%, USG% and PIE are season totals across teams.