Skip to content
Blazing the Nets
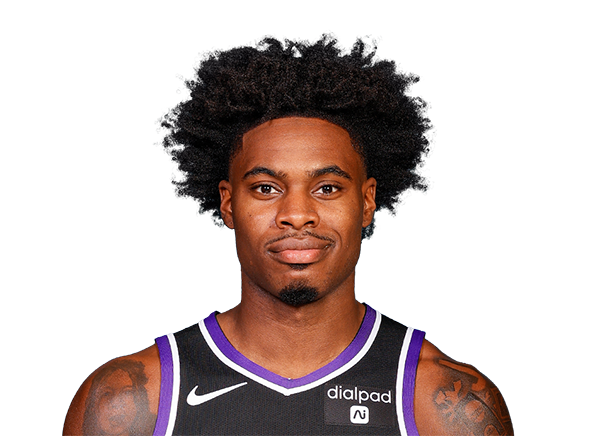
Davion Mitchell

Davion Mitchell

MIA · 2026-27 regular season

79/158 FG · 50.0% FG% · 59.8% eFG% · 41.9% 3P% (31/74)

13 GP · 35.7 MIN · 18.2% USG% · 62.2% TS% · 10.7% PIE

MIA team page →

League ranks

Among players with 100+ field-goal attempts this regular season; season stats where the release has them, else play-by-play shots. 3P% also needs 50+ three-point attempts; TS% needs a season-stats row (free throws are not in the shot data).

Game-by-game views are unavailable for this season: the release's game logs do not cover every game this player shot in.

Every game; league lines: full regular season.

Shot chart

Export

Davion Mitchell 2026-27 shot chart158 attempts in 69 hexes. By zone: Restricted area 26/40 (65.0%, league 65.6%); Paint (non-RA) 17/36 (47.2%, league 44.4%); Mid-range 5/8 (62.5%, league 40.1%); Left corner 3 2/4 (50.0%, league 36.1%); Right corner 3 3/7 (42.9%, league 36.0%); Above-the-break 3 26/63 (41.3%, league 34.8%).

Shooting signature

Davion Mitchell 2026-27 FG% by distance vs leagueFG% by distance against the league: 0-4 ft 28/44 (63.6%, league 60.8%); 5-9 ft 13/28 (46.4%, league 43.5%); 10-14 ft 3/6 (50.0%, league 44.0%); 15-19 ft 3/4 (75.0%, league 41.5%); 20-24 ft 5/13 (38.5%, league 36.0%); 25-29 ft 27/60 (45.0%, league 34.8%); 30-34 ft 0/2 (0.0%, league 22.2%); 35-35 ft 0/1 (0.0%, league 14.3%).

Shot proportion by distance

Davion Mitchell 2026-27 share of shots by distance vs leagueshare of shots by distance, player vs league: 0-2 ft 13.9% vs 19.9%; 3-5 ft 20.9% vs 13.1%; 6-8 ft 7.0% vs 7.0%; 9-11 ft 6.3% vs 5.8%; 12-14 ft 1.3% vs 4.7%; 15-17 ft 1.3% vs 3.5%; 18-20 ft 1.9% vs 2.1%; 21-23 ft 4.4% vs 5.6%; 24-26 ft 34.8% vs 29.5%; 27-29 ft 6.3% vs 7.8%; 30-32 ft 0.6% vs 0.8%; 33-35 ft 1.3% vs 0.1%.

Field goal percentage by distance

Davion Mitchell 2026-27 FG% by distance vs leagueFG% by distance, player vs league: 0-2 ft 54.5% vs 70.0%; 3-5 ft 63.6% vs 50.1%; 6-8 ft 36.4% vs 42.9%; 9-11 ft 60.0% vs 44.0%; 12-14 ft 50.0% vs 44.5%; 15-17 ft 100.0% vs 41.9%; 18-20 ft 33.3% vs 38.9%; 21-23 ft 42.9% vs 35.0%; 24-26 ft 41.8% vs 35.5%; 27-29 ft 60.0% vs 34.3%; 30-32 ft 0.0% vs 33.8%; 33-35 ft 0.0% vs 15.2%.

Shooting frequency by side

Davion Mitchell 2026-27 share of shots left, centre and right of the hoopshare of shots left, centre and right of the hoop (league in brackets): 0-2 ft left 8.9% (7.6%), centre 0.0% (3.7%), right 5.1% (8.6%); 3-5 ft left 12.0% (6.2%), centre 0.6% (0.2%), right 8.2% (6.8%); 6-8 ft left 3.8% (3.3%), centre 0.0% (0.1%), right 3.2% (3.6%); 9-11 ft left 3.2% (2.8%), centre 0.0% (0.0%), right 3.2% (3.0%); 12-14 ft left 0.6% (2.4%), centre 0.0% (0.0%), right 0.6% (2.3%); 15-17 ft left 1.3% (1.7%), centre 0.0% (0.0%), right 0.0% (1.8%); 18-20 ft left 1.3% (1.1%), centre 0.0% (0.0%), right 0.6% (1.1%); 21-23 ft left 2.5% (3.0%), centre 0.0% (0.0%), right 1.9% (2.7%); 24-26 ft left 13.3% (15.3%), centre 0.0% (0.1%), right 21.5% (14.1%); 27-29 ft left 4.4% (3.9%), centre 0.0% (0.0%), right 1.9% (3.9%); 30-32 ft left 0.6% (0.5%), centre 0.0% (0.0%), right 0.0% (0.4%); 33-35 ft left 0.0% (0.1%), centre 0.0% (0.0%), right 1.3% (0.1%).

Field goal percentage by side

Davion Mitchell 2026-27 FG% left, centre and right of the hoopFG% left, centre and right of the hoop (league in brackets): 0-2 ft left 50.0% (70.1%), centre n/a (65.9%), right 62.5% (71.6%); 3-5 ft left 63.2% (50.0%), centre n/a (61.8%), right 69.2% (50.0%); 6-8 ft left 33.3% (42.8%), centre n/a (48.0%), right 40.0% (42.8%); 9-11 ft left 60.0% (43.2%), centre n/a (40.0%), right 60.0% (44.9%); 24-26 ft left 28.6% (35.5%), centre n/a (30.0%), right 50.0% (35.5%); 27-29 ft left 57.1% (35.6%), centre n/a (11.1%), right n/a (33.2%).